Explain this Map
Explain this Map sends what's on your map to a frontier model on your Databricks workspace and streams back an explanation: the area, the patterns, hotspots and outliers, and what's worth investigating next. It uses your existing Databricks sign-in, so there's no API key and no extra subscription.
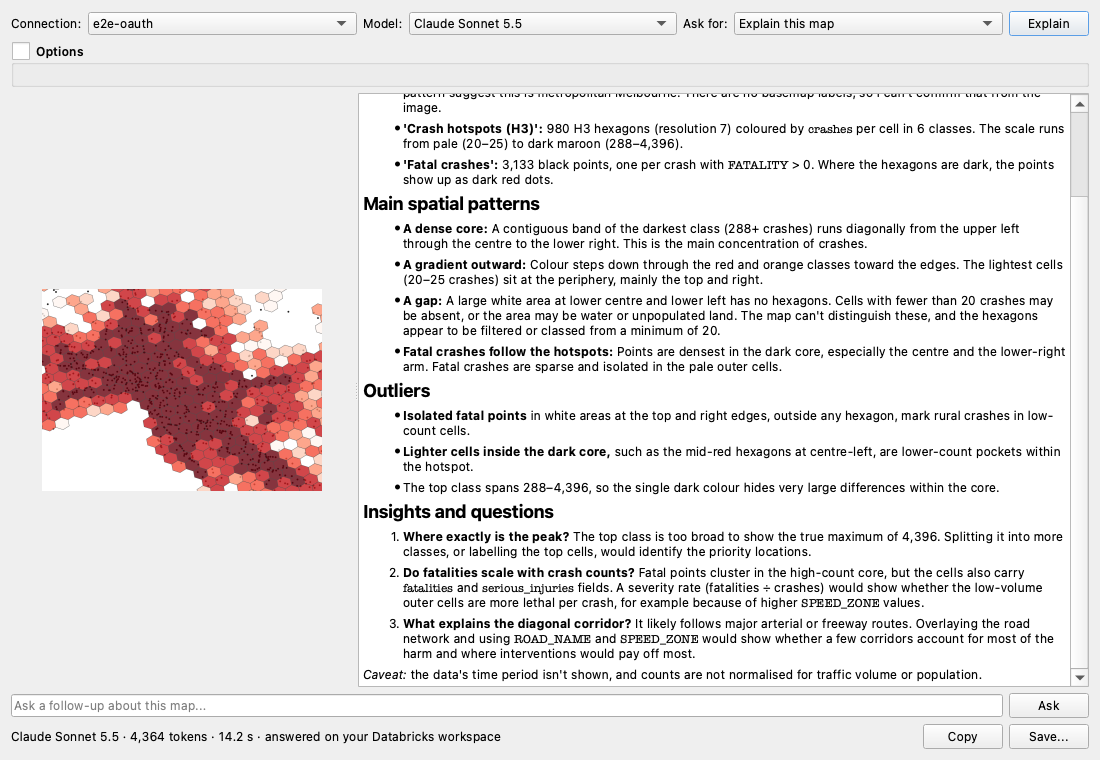
One click
- Set up the map you want explained: layers, styling and zoom.
- Click the Explain this Map toolbar button (a red map with a sparkle), or Plugins → Databricks DBSQL Connector → Explain this Map.
- The explanation appears in a few seconds and fills in as it's written. The left side shows the image that was sent.
The first time, it uses your last-used saved connection and picks the best available model automatically. After that it remembers your choices.
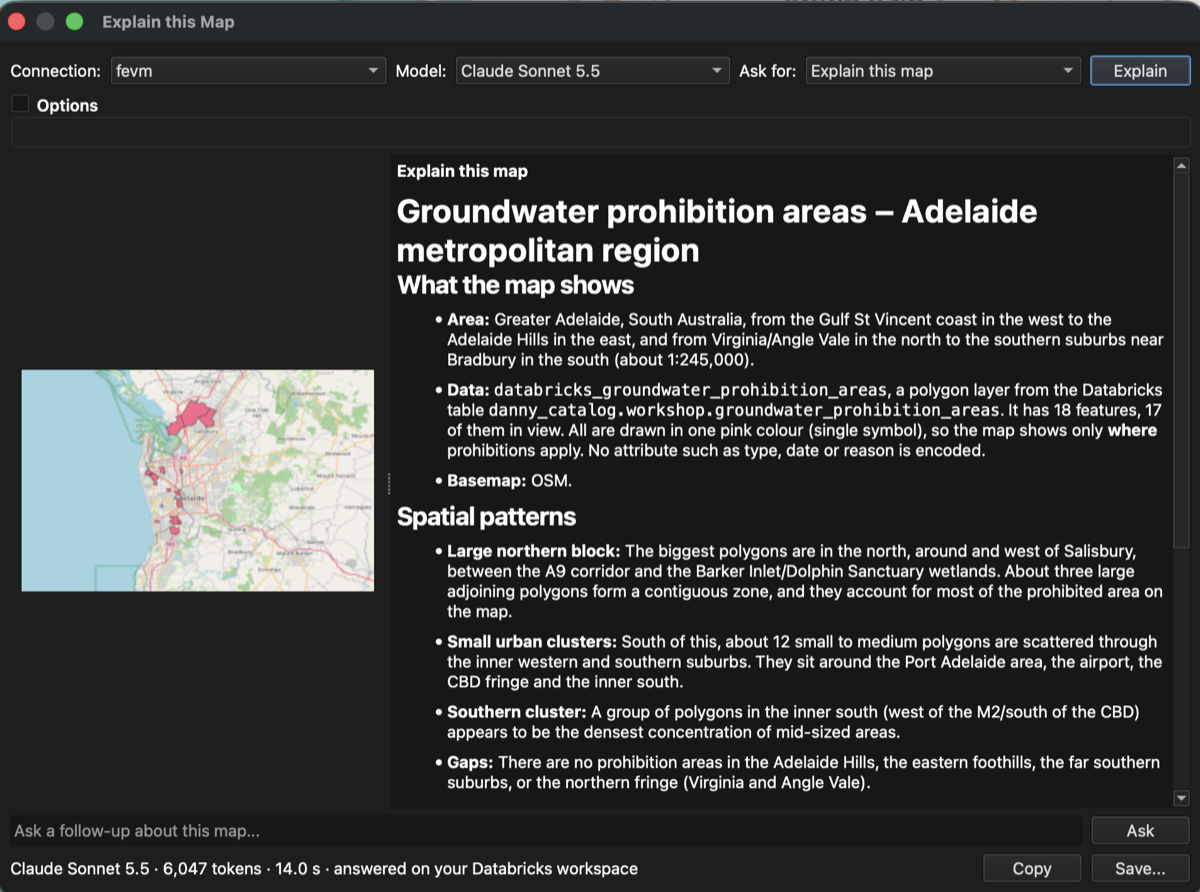
It works on any map. Here it explains groundwater prohibition areas around Adelaide, a Unity Catalog table added with Discover Tables, shown in QGIS's dark theme:
You need a saved connection first. If you don't have one, the plugin opens the connection dialog for you.
What the model sees
Alongside a sharp image of the current view, the plugin sends map facts, so answers use your real names and numbers instead of guessing from colours: - coordinate system, scale and area (longitude/latitude) - each visible layer: name, geometry type, feature count, and how many are in view - what each layer's style encodes, for example graduated by 'crashes' in 6 classes: 20-35 (#fee5d9) … 288-4396 (#67000d) - labels, selections, and the Databricks table or SQL behind each layer
Optional knobs
Everything below is optional and remembered between sessions.
| Control | What it does |
|---|---|
| Model | Pick any model on your workspace that can read images (Claude, GPT, Gemini, Llama and more). Only image-capable models are listed |
| Ask for | Prompt presets: Explain this map · Summary for a report (one polished paragraph) · Patterns and outliers · Title, caption and alt text (for layouts and accessibility) · Next analysis steps (QGIS or Databricks SQL) |
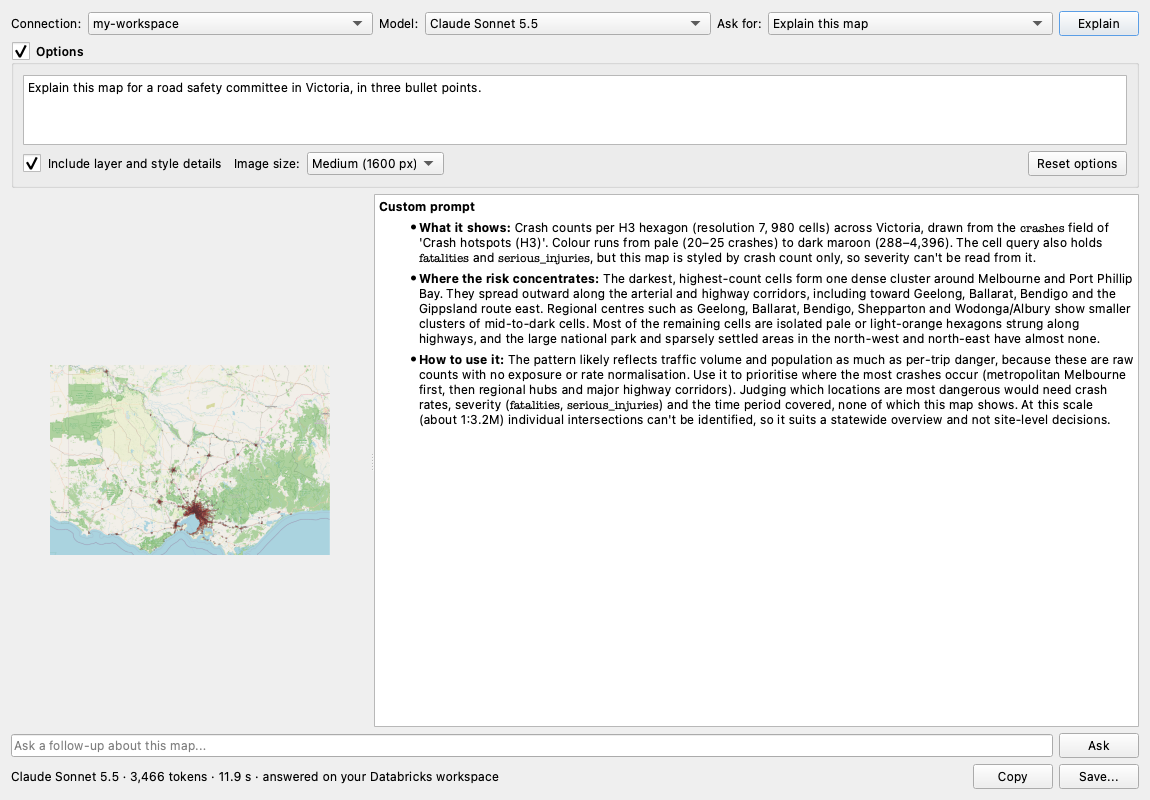
| Options → Custom prompt | Write your own instruction, e.g. "Explain this map for a road safety committee in Victoria". Leave it empty to use the preset |
| Options → Include layer and style details | Turn the map facts off to send only the image |
| Options → Image size | Small (1024 px), Medium (1600 px, default) or Large (2048 px). Larger shows more detail and uses more tokens. Busy maps (for example a detailed basemap) are sent as JPEG so they always fit the model's image limit |
| Explain | Capture the map again (after panning, restyling or changing options) and explain it |
After the answer
- Ask a follow-up about the same map, e.g. "Which areas should we prioritise?". The conversation continues with the same image.
- Copy the explanation, or Save... it as Markdown with the map image beside it (
.md+.png, or.jpgfor busy maps), ready for a report or wiki. - The status line shows the model, tokens used and time taken.
Tips
- Style first, then explain. A clear legend (graduated or categorised) gives the model much better material than a single colour.
- Zoom to what matters. The image and the facts describe the current view.
- Add a basemap (see Basemaps) so the model can recognise places.
- Treat the answer like a colleague's first read of the map: useful, and worth checking against your data.
Where it runs
The image and map facts go to the model's serving endpoint on your Databricks workspace, using your saved connection's sign-in and your workspace's model access and governance (including AI Gateway settings, if your admins use them). Model availability depends on your workspace and region. If a model can't read images, or isn't available, you'll see a short message and can pick another in Model.