Genie One
Genie One answers questions across your whole workspace: there's no Genie Agent to choose. It finds the right data, runs SQL, and can draw charts. Results with geometry can go straight onto the map.
Ask a question
- Open Plugins → Databricks DBSQL Connector → Databricks Genie One, or click the Genie lamp on the toolbar.
- Connection: pick a saved connection (OAuth or personal access token).
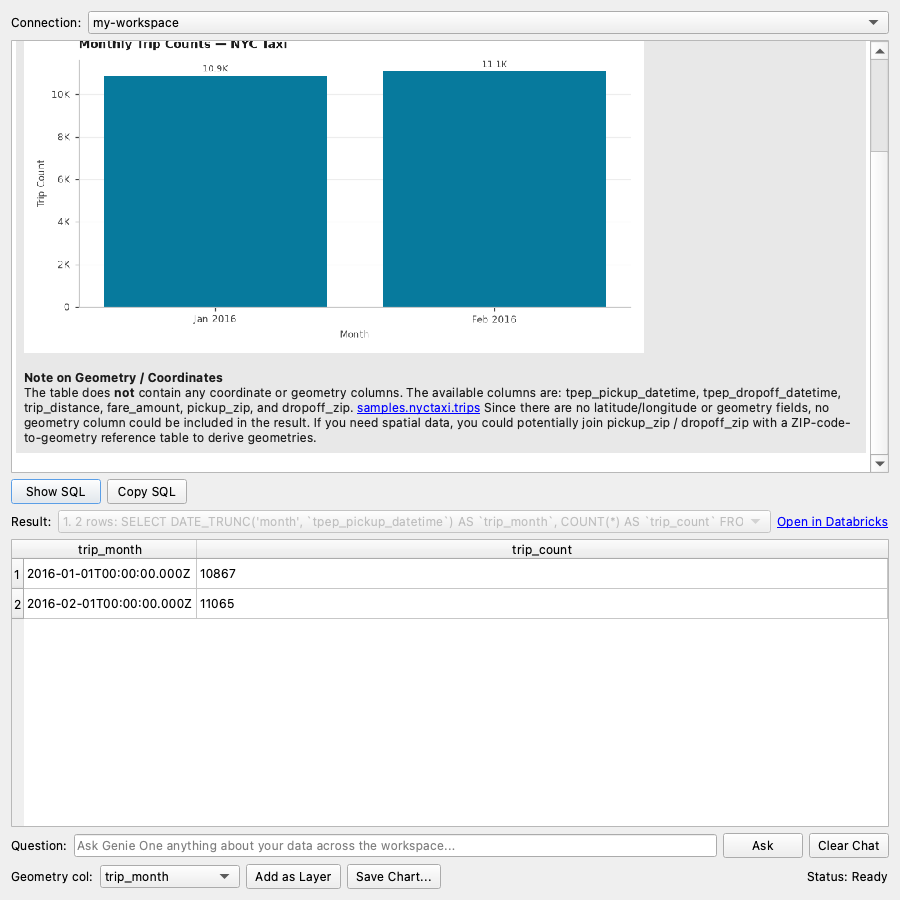
- Type in Question, e.g. "Show monthly trip counts in samples.nyctaxi.trips as a bar chart", and click Ask.
- Watch Genie One's progress in the chat and status bar, e.g. "Running SQL: SELECT …". Click Cancel to stop.
- The answer appears with Genie One's chart drawn where Genie places it, plus the result table.
Use the results
| Control | What it does |
|---|---|
| Result | Genie One may run several queries per answer. Pick one to see its rows and SQL |
| Open in Databricks | Continue the same conversation in Genie One in your browser |
| Show SQL / Copy SQL | See or copy the selected query |
| Geometry col + Add as Layer | Put spatial results on the map |
| Save Chart... | Save the latest chart as a PNG |
| Clear Chat | Start a new conversation |
Tips
- Follow-ups keep the conversation going, e.g. "Only the top 5".
- Charts are drawn in QGIS from Genie One's own chart definition: bar, line, area, scatter and pie, including dual axes and stacked bars. If Genie One returns chart-shaped data without a chart, the plugin draws a simple one and labels it "Chart drawn by the plugin…".
- Genie One needs to be enabled in your workspace. If it isn't, you'll see "Genie One is not available on this workspace".
- Results respect your Unity Catalog permissions.