Basemaps and styling
Add a basemap
QGIS lists web basemaps under XYZ Tiles in the Browser panel.
- Show the panel if needed: View → Panels → Browser.
- Expand XYZ Tiles and double-click OpenStreetMap.
- In the Layers panel, drag the basemap to the bottom so your Databricks layers draw on top.
If OpenStreetMap isn't listed, or you want another basemap, right-click XYZ Tiles → New Connection… and add one of these:
| Name | URL | Max zoom |
|---|---|---|
| OpenStreetMap | https://tile.openstreetmap.org/{z}/{x}/{y}.png |
19 |
| Esri Light Gray Canvas (subtle, good under data) | https://server.arcgisonline.com/ArcGIS/rest/services/Canvas/World_Light_Gray_Base/MapServer/tile/{z}/{y}/{x} |
16 |
| Esri World Imagery (satellite) | https://server.arcgisonline.com/ArcGIS/rest/services/World_Imagery/MapServer/tile/{z}/{y}/{x} |
19 |
- Esri URLs end
{z}/{y}/{x}and OSM ends{z}/{x}/{y}. Swapping them puts tiles in the wrong place. - CARTO basemaps now need an API key; without one they show "API KEY REQUIRED" watermarks.
- Check each provider's terms of use and attribution for published maps.
Style a layer
Right-click a layer → Properties… → Symbology.
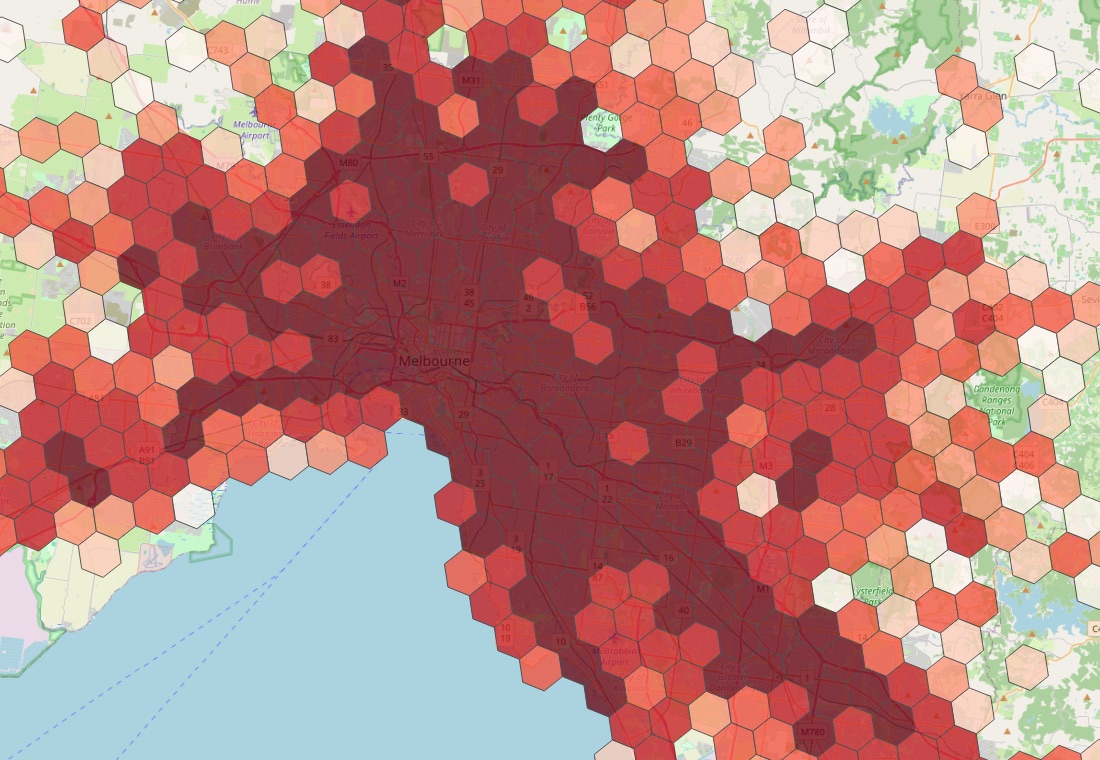
Heat map of counts (e.g. the H3 hotspot query in Custom SQL queries):
1. Change Single Symbol to Graduated.
2. Value: crashes. Color ramp: Reds. Mode: Quantile. Classes: 6.
3. Click Classify, then OK. Set Opacity to about 75% on the Layer Rendering section so the basemap shows through.
Colour by category (e.g. SEVERITY): choose Categorized, Value: the column, Classify.
Styles are saved with the project, including for layers saved in the project, so they look the same when reopened.